|
1) A new
bright galaxy of the Local Group VV124 (UGC4879) is found. The last discovery
of such a bright galaxy of the Local Group was made 40 years ago. Taking into
account all the works of recent years on the search for nearby galaxies, it can
be stated that the VV124 is the latest found bright galaxy belonging to the
Local Group of galaxies.
Kopylov A.I., Tikhonov
N.A., Fabrika
S.N., Drozdovsky I.O., Valeev A.F., MNRAS
Lett, V. 387, Issue 1, L45, 2008. Tikhonov N.A., Fabrika S.N., Sholukhova O.N., Kopylov A.I., Astronomy Letters, V. 36, Issue 5, p. 309, 2010. |
 Fig. 1. Galaxy VV124 (BTA image). |
||
|
2) Within a
few decades, there was a popular hypothesis about the possibility for primary
young galaxies with low metalicity and the first wave of star formation in the
history of these galaxies to be found in the relatively close neighborhood of
our galaxy. As a sample of galaxies of this type the 1Zw18 galaxy has been
always called for. Using the Hubble Space Telescope images, we carried out stellar
photometry for 1Zw18 and for the first time we had found in this galaxy red
giants with the age of several billion years, which immediately rejected the
hypothesis that the galaxy was young.
|
 Fig. 2. Galaxy 1Zw18 (HST image). |
||
|
3) Dynamical
and photometrical (near-infrared, in K-band) characteristics of 183 groups and
clusters of galaxies located in the regions of superclusters of galaxies
Hercules, Leo, Ursa Major, Bootes, Corona Borealis and outside superclusters
having radial velocities in the interval 0.012<z<0.09 (+ Virgo cluster)
based on the archival data from the SDSS, 2MASX, NED catalogues are determined.
The IR-luminosity of the systems of galaxies mainly corresponding to the
luminosity of old stars from early-type galaxies allows to the first approximation
to estimate their masses according to the correlation between dynamical mass
and IR-luminosity. For systems of galaxies in the regions of the Hercules
and Leo superclusters the dwarf-to-giant
ratio of galaxies in the r-band is evaluated, and it is found that this ratio
increases with increasing X-ray luminosity at log LX > 43.5 erg/s. Kopylova
F.G., Kopylov A.I., Ast. Bull. 64, 1, 2009. |
 |
||
|
|
|||
|
4) Using the data of catalogues of SDSS DR8 we investigated the peculiar motions of groups and clusters of galaxies in the regions of Hercules, Leo, Bootes, Ursa Major, Corona Borealis, A2142, Z5029/A1424, A1190, A1750/A1809. For this purpose, we compiled a samples of ealy-type galaxies in them and determined the fundamental plane distances and peculiar velocities. For all superclusters of galaxies is Hubble's law between the radial velocity and distance obtained by the fundamental plane of early-type galaxies. Within their regions the significant peculiar motion rms deviations along the line of sight 736±50 km/s × Hercules, 625±70 km/s × Leo, 757±70 km/s × Bootes, 290±120 km/s × Ursa Major, 652±50 km/s × Corona Borealis, 1366±170 km/s × Z5029/A1424. The pecular motions of clusters we found in the Corona Borealis region are characterized by gravitational coupling of this supercluster with the supercluster A2142. The rms deviation of peculiar velocities of 20 clusters of galaxies outside the largest structures, is equal to 0±20 km/s. Kopylova
F.G., Kopylov A.I.,
Astron. L. 33, 211, 2007. |
 Fig. 4. The map of distribution of galaxies and clusters in the region of Hercules and
Leo superclusters with radial velocities in the range of cz = 8000–13000 km/s.
|
||
|
|
|||
|
5) The study was performed of four complex (bimodal) Abell clusters with difference of radial velocities between the subclusters of about 3000 km/s, which may be due either to the gravitational interaction between very massive clusters at a collision on the line close to the line-of-sight or the projection along the line-of-sight of non-connected clusters. Using observational data from the 1-m telescope of SAO RAS and data of the SDSS catalogue we measured photometric relative distances (by the Kormendy relation and the fundamental plane) and revealed the structure of clusters A1035, A1569, A1775 and A1831. It is found that subclusters in these clusters are not bound gravitationally, and for them the Hubble law is obeyed. Kopylov
A.I., Kopylova F.G., Ast. Bull.
62, 311, 2007. |
 Fig. 5. The Hubble diagram (velocity [zspec]
– distance [zphot]) is
shown for four bimodal clusters of galaxies (A-components to left, B-components
to right), and for the cluster A1589, the nearest rich neighbour (12 Mpc) of the
cluster A1569A.
|
||
|
|
|||
| 6) The dependence between the physical parameters of
low-mass spiral and irregular galaxies is found. Based on the stellar
photometry of the Hubble Space Telescope images in 53 low-mass spiral and irregular
galaxies, young (supergiants) and old (red giants) star subsystems are
identified and their spatial dimensions and metallicity of the red giants are
determined. For the first time a well-defined correlation was found between the
metallicity of red giants and the difference in the sizes of star subsystems of
different ages. The resulting correlation is interpreted as a result of the
combined effect of two relationships:1) between the mass of galaxies and the
metallicity of stars; 2) between the change in size of subsystem stars and the
evolution time of galaxies, where the change in the metallicity of galaxies is
taken as a time scale.
Tikhonov N.A., ASPCS, 510, 488, 20. |
Fig. 6. Diagram
of the relationship between the size difference (R-B) of the red giant
(R) subsystems and the blue supergiants (B) and the metallicity of the
red giants [Fe/H] of the same galaxies. The
dependence found can be interpreted as an increase in the size of the
star subsystems of irregular galaxies during their evolution.
|
||
| 7) Stellar
photometry was performed from the images of the Hubble Space Telescope
on 105 irregular or low-mass spiral galaxies.Distances to the galaxies
were determined by the TRGB method and metallicities of old stars (red
giants) were measured. The index of metallicity of young stars is taken
to be the color index (V-I) of the branch of red supergiants, since it
depends on the metallicity of the stars. Basing on the obtained results, a diagram of the relationship between the metallicities of young and old stars is constructed. A good correspondence between the metallicities compared indicates that the main process of saturation of galaxies with metals occurred at the early stages of their evolution, and the possible merge of galaxies with small metal intergalactic gas clouds had an insignificant effect on the change in the metallicity of the galaxies. Tikhonov N.A., Ast. Bull., 73, 22, 2018. |
 Fig. 7. Dependence
between the metallicity of red giants and the color index (V–I) of red
supergiants, which is equivalent to the metallicity of young stars of
the same galaxies. In
the process of falling of the significant masses of a low-metal gas
onto the galaxies, the points on the diagram shift toward smaller values
(V–I),
as it is observed in the galaxy KK16. The galaxies where the
intergalactic gas is likely to fall are contained inside the the
parallelogram drawn on the diagram.
|
||
|
|
|
||
| 8) For
84 groups of galaxies with σ < 420 km/s by plotting (ΔM1,4) magnitude gap between the first and fourth brightest galaxies
and the concentration of galaxies (Σ5) determined from the
fifth galaxy from the center, we have identified areas of location of «young» and «old» systems of galaxies. We have estimated the dynamic
ages of the groups of galaxies comparing the luminosity of the
brightest galaxy and the magnitude gap (ΔM1,4) with the
theoretical model calculations (Raouf et al., 2014, MNRAS, 442, 1578).
A probability that the selected groups belong to the category of «old»
groups or «young» is equal 50%. It is found that the fraction of
early-type galaxies in systems is not dependent neither on
concentration of galaxies nor on mass or total luminosity and luminosity in X-ray. Kopylova F. G., Kopylov A. I., Ast.Bull., 72, 100, 2017. |
Fig. 8. Magnitude
gap ΔM1,4 as function of the concentration of galaxies.
Galaxy groups with z < 0.027 É σ < 420 km/s are shown by
filled circles, those with z > 0.027 É σ < 420 km/s – by
open circles, and the dots show the rich galaxy clusters with σ
> 420 km/s. The large triangles show the dynamically «old» with a
probability higher than 50% galaxy systems, and the large circles show
the dynamically «young» ones with the same probability. A straight line
corresponding ΔM1,4 = 2.5 separates the candidates in the
oldest groups of galaxies – «fossil» groups.
|
||
| 9) We have
developed a new method for determining the size of galaxy clusters, the
region with a radius of Rh (or Rsp) (>R200), from the
cumulative distribution of the number of galaxies depending on the
squared clustercentric distance, where Rh (or Rsp) radius of
apocenter of orbits of galaxies. This allowed to determine for the
systems of galaxies the total K-luminosity and the number of galaxies
corrected for the background. K-luminosity, effective radius containing
either half of the luminosity, or half the number of galaxies and
dispersion of radial velocities of galaxy systems form a Fundamental
plane (FP) LK = Re0.71×σ1.33. We also built the FP in
the X-ray, LX = Re1.26×σ2.70. In addition, we
obtained that the form of FP clusters consistent with the form of the
FP of early-type galaxies in the r (SDSS) filter. Kopylova F. G., Kopylov, A. I., Ast.Bull., 71, 129, 2016. |

Fig. 9. The fundamental plane of early-type
galaxies (red circles) and group and clusters of galaxies (blue
circles) vs. the long axis logRe. The effective radius Re of
clusters of galaxies is determined as radius containing half of the galaxies.
|
||
|
|
|
||
|
|
|
|
|
|
|
10) In order to study the star formation rate, morphological composition and other characteristics in the outskirts of clusters of galaxies, we have compiled a sample of the 27 clusters of galaxies with the following parameters: 0.020 < z < 0.045 É σ > 400 km/s. For them, we measured by archived data SDSS DR7-8, 2MASX, NED catalogues dynamic characteristics and determined the nearest outskirts in units of radius R200 (of radius, within which the density in the cluster exceeds the critical density of the Universe 200 times), and in units of the radius Rsp~1.5×R200 (apocenter of the orbits of galaxies) found by us on the observed profile of clusters of galaxies. Kopylova F. G., Kopylov, A. I., Ast.Bull., 73, 2, 267, 2018. |
 Fig.10. Distribution of
galaxies in the cluster A2040 (z = 0.045, σ = 589 ËÍ/Ó). The
upper left figure shows the deviation of radial velocities of galaxies – members of clusters and galaxies attributed to the background from the average radial velocity of the cluster, depending on the squared clustercentric radius. The lower left figure – the integral distribution of the number of
galaxies depending oh the squared clustercentric radius. The upper
right figure – the location of galaxies in sky plane in equatorial
coordinates. The lower right figure – the histrogram of line-of-sight
velocities of all galaxies within R200 (the solid line shows the
Gaussian corresponding to the dispersion of line-of-sight velocities).
The blue dashed line shows radius R200, the red dash-dotted line – radius Rsp.
|
|
|
11) For clusters of
galaxies A1656 (Coma), A1139, A1314 (Leo supercluster), A2040, A2052,
A2107 (Hercules supercluster) the fraction of early-type galaxies on
the «red sequence», determined by the color-magnitude relation, is
measured. It is obtained that this fraction – on the outskirts, outside
the Rsp – is minimal and corresponds to the value for the field 0.24±0.01, which has the same range of radial velocities, the size
300 arcminutes and the coordinates of the center: 14h.5, 35o.
Kopylova F. G., Kopylov, A. I., Ast.Bull., 73, 2, 267, 2018. |
 Fig.11. Phase-space
diagram (velocity – radius) of cluster A1656. The velocity is the ratio
of the difference of the radial velocities of galaxies and mean radial
velocity of the cluster to its dispersion of radial velocities. The
radius R/R200 is the clustercentric distance of galaxy, normalized
to a radius of R200. Red circles show the «red sequences» early-type galaxies. Cluster galaxies are selected within 2.7 σ.
|
||
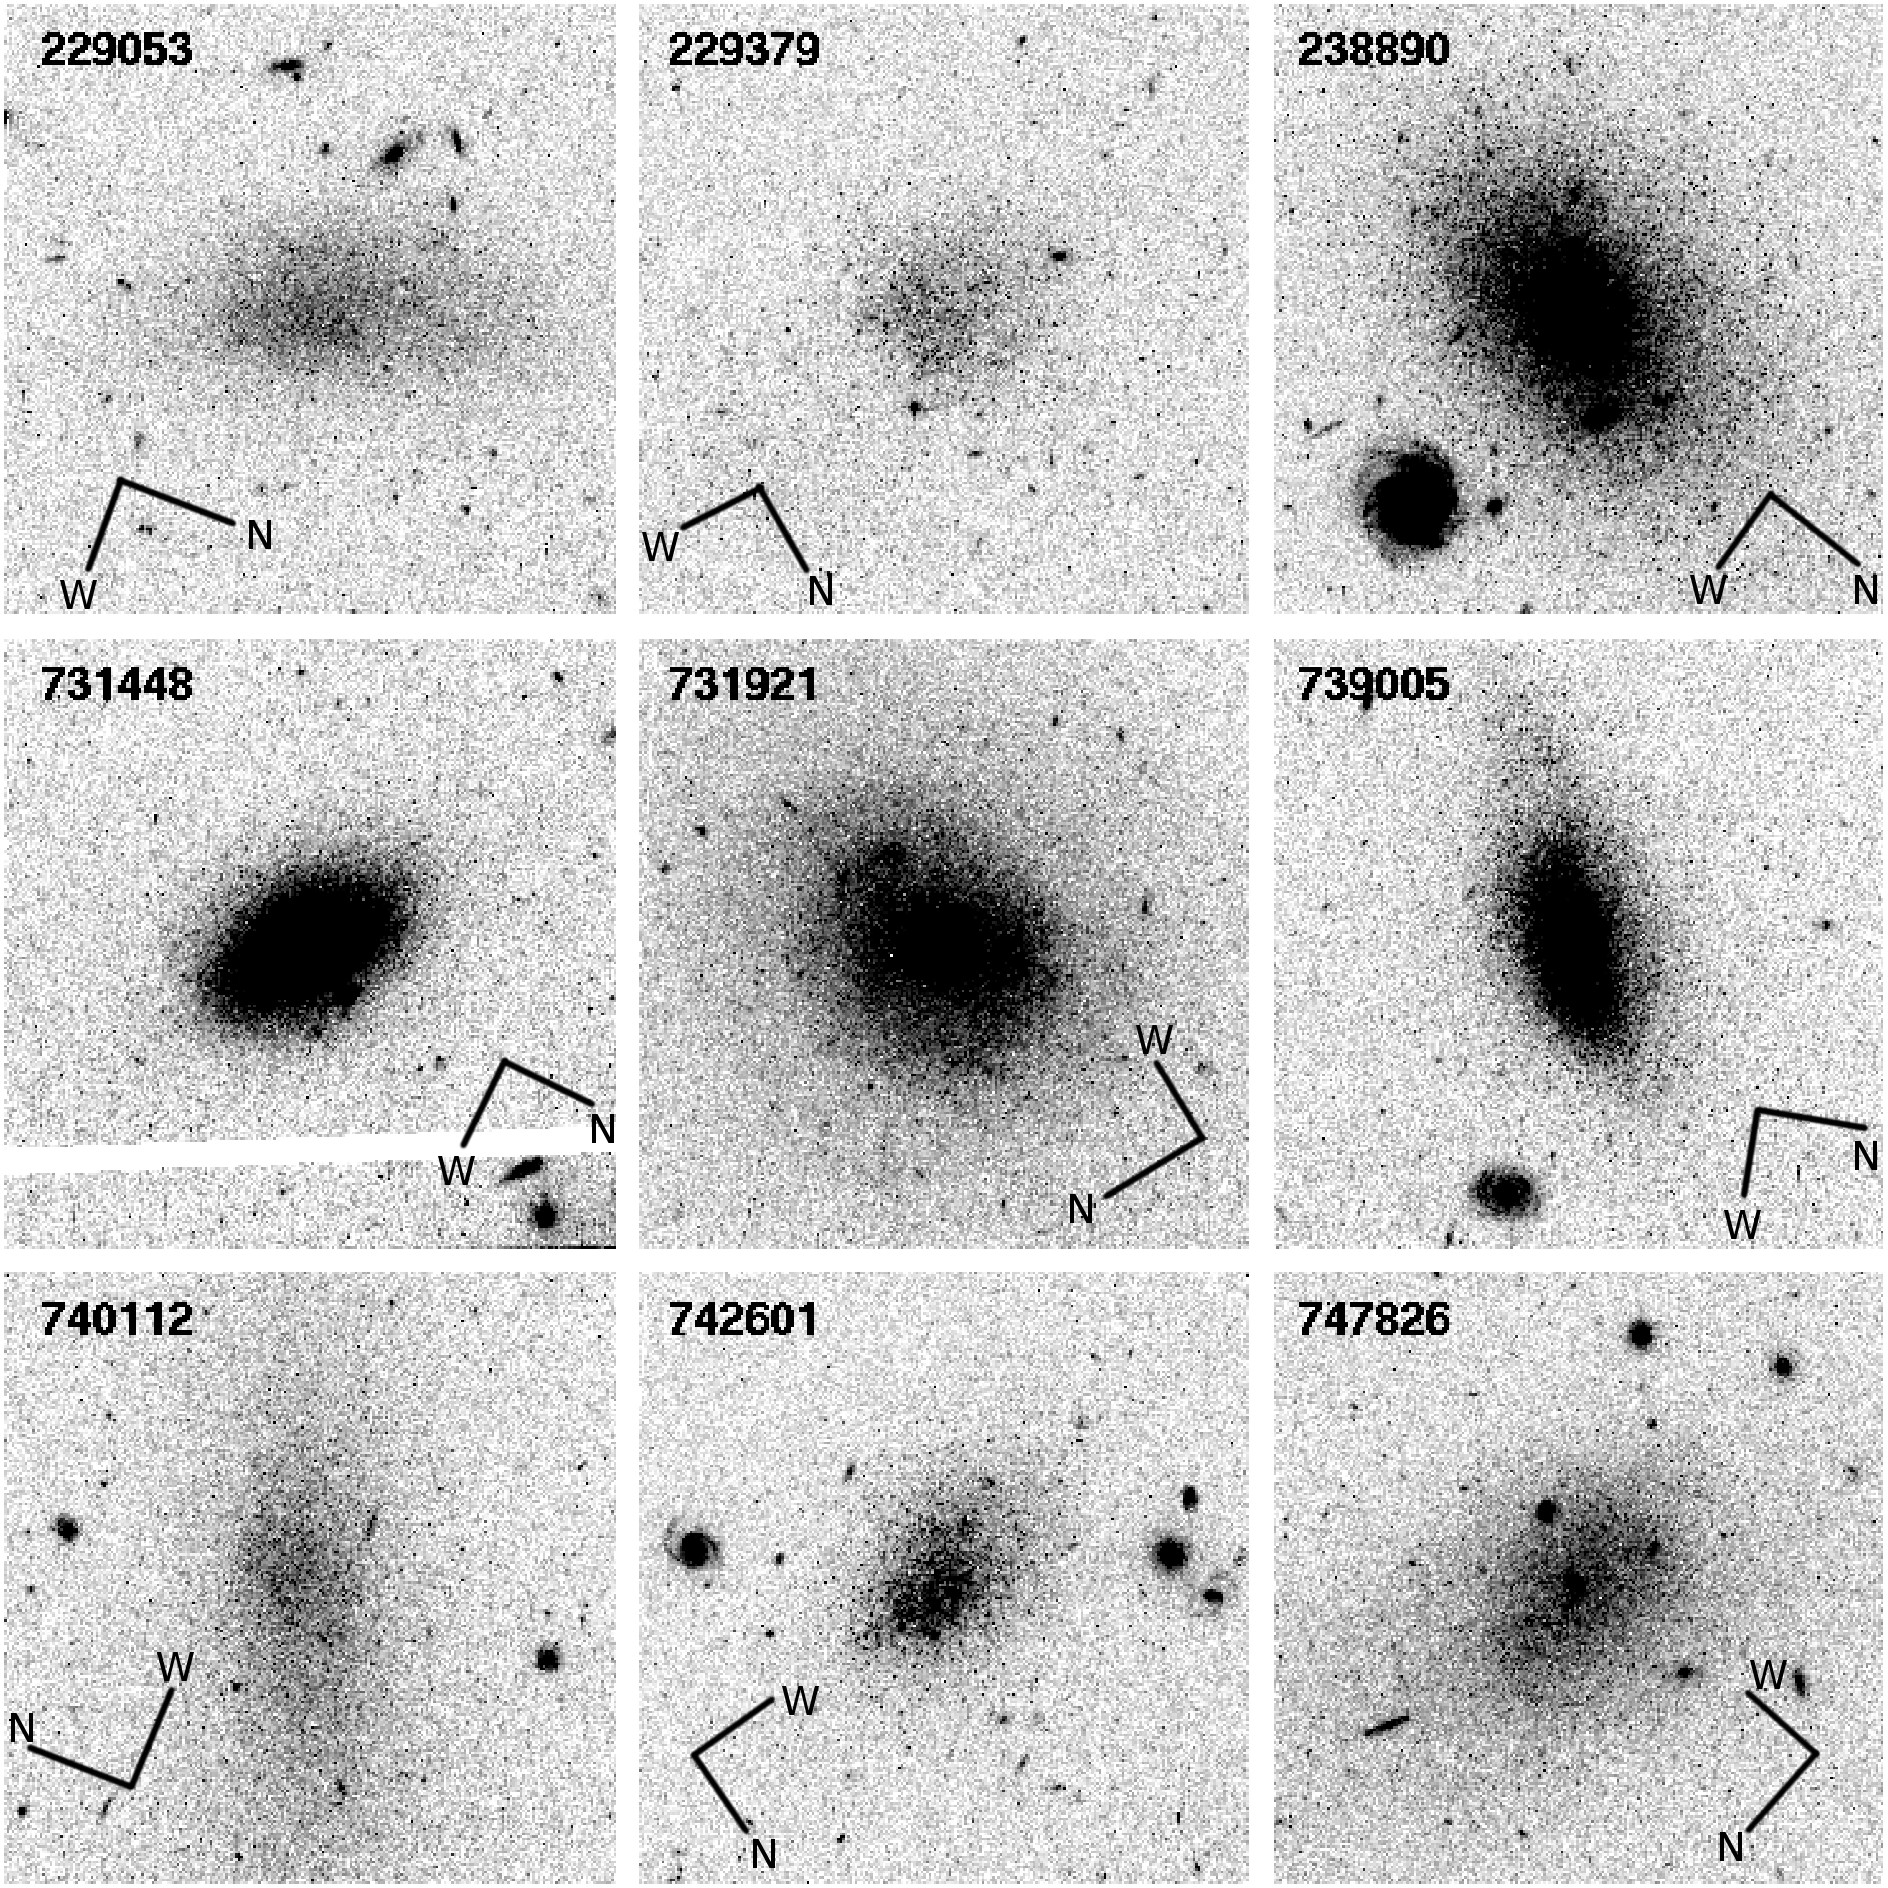
| 12) Based on archival Hubble Space Telescope images, we have performed stellar photometry for 18 dwarf galaxies. Branches of young and old stars are seen on the constructed Hertzsprung-Russell diagrams. Using the photometry of red giants and applying the TRGB method, we have determined accurate distances for all 18 galaxies for the first time. The galaxies AGC 238890 and AGC 747826 have minimum (D = 5.1 Mpc) and maximum (D = 12.0 Mpc) distances, respectively. The distances to the remaining galaxies lie within this range. Low-metallicity galaxies have been identified by measuring the color indices of the red giant branch: AGC 102728, AGC 198691, AGC 205590, AGC 223231, AGC 731921, and AGC 747826. | 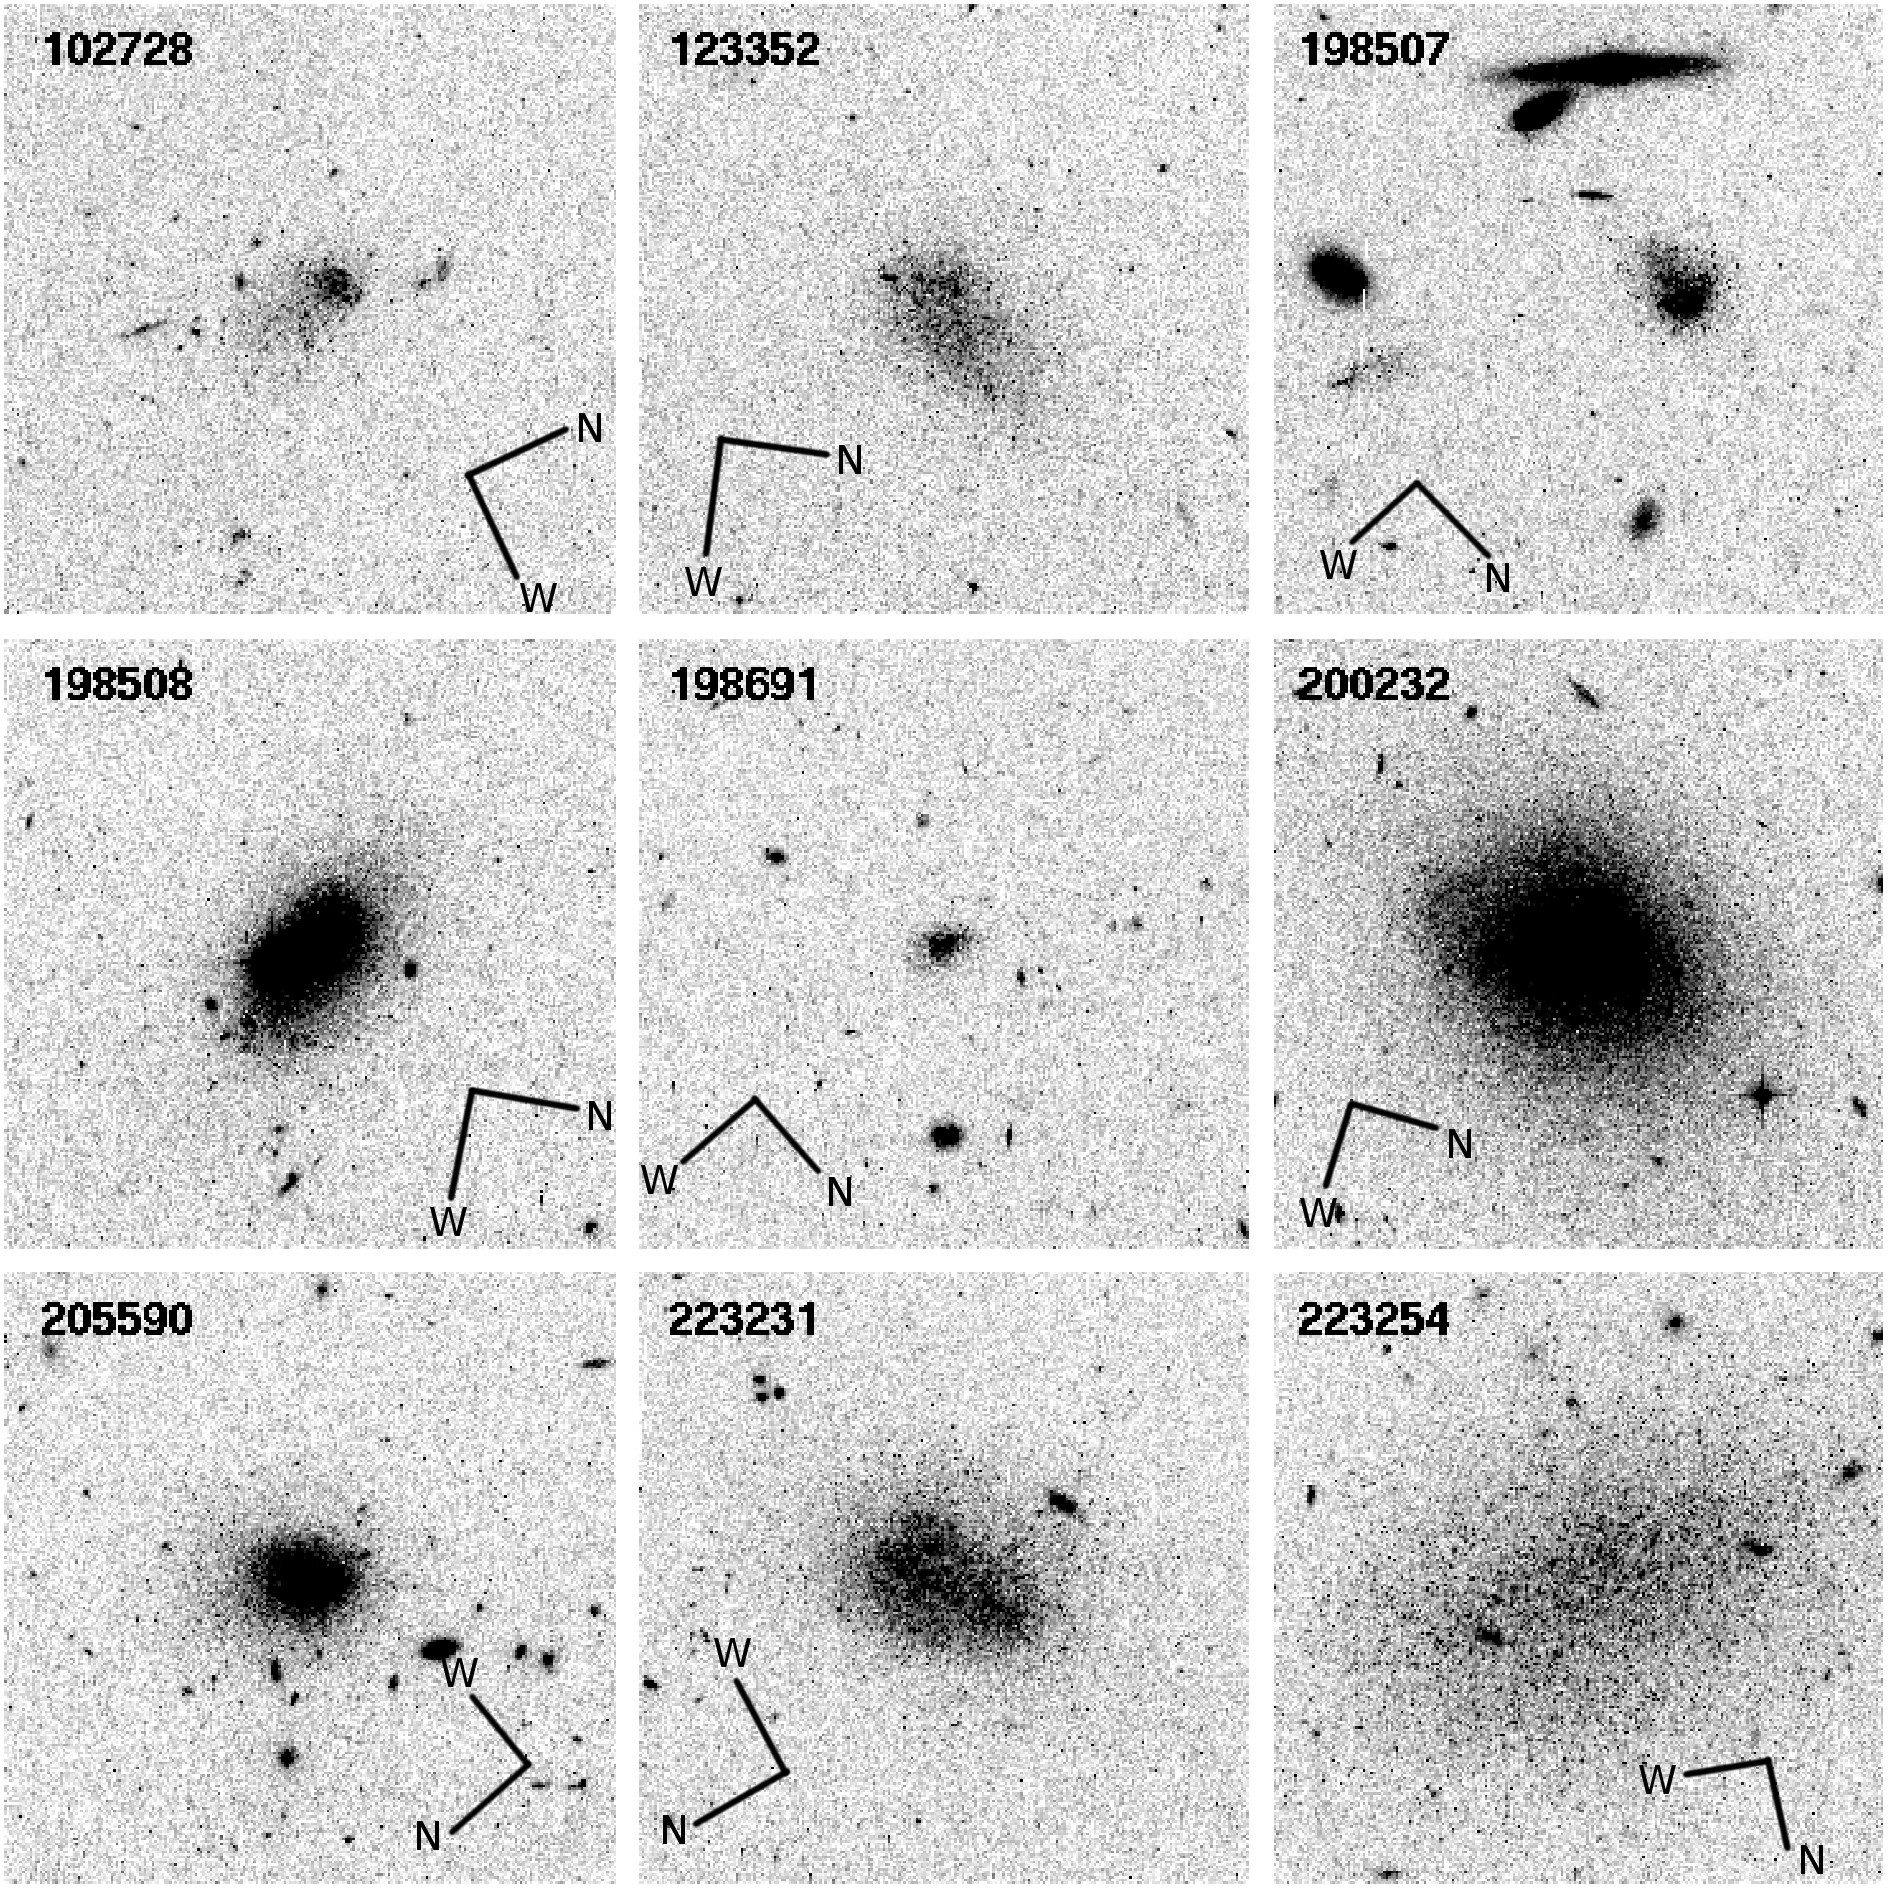 |
||
| We have determined the distance to AGC 198691 with a record low
metallicity. Since AGC 223254, AGC 229053, AGC 229379, AGC 238890, AGC
731921, and AGC 742601 are projected onto the Virgo cluster of galaxies,
the distances estimated by us together with the velocities of these
galaxies measured previously at Arecibo can be used to refine the effect
of galaxy infall to the Virgo cluster. Tikhonov N.A., Galazutdinova O.A., Astron. L. 45, 11, 750, 2020. |
 |
||
| Fig.12. HST images of 18 dwarf galaxies. | |||
|
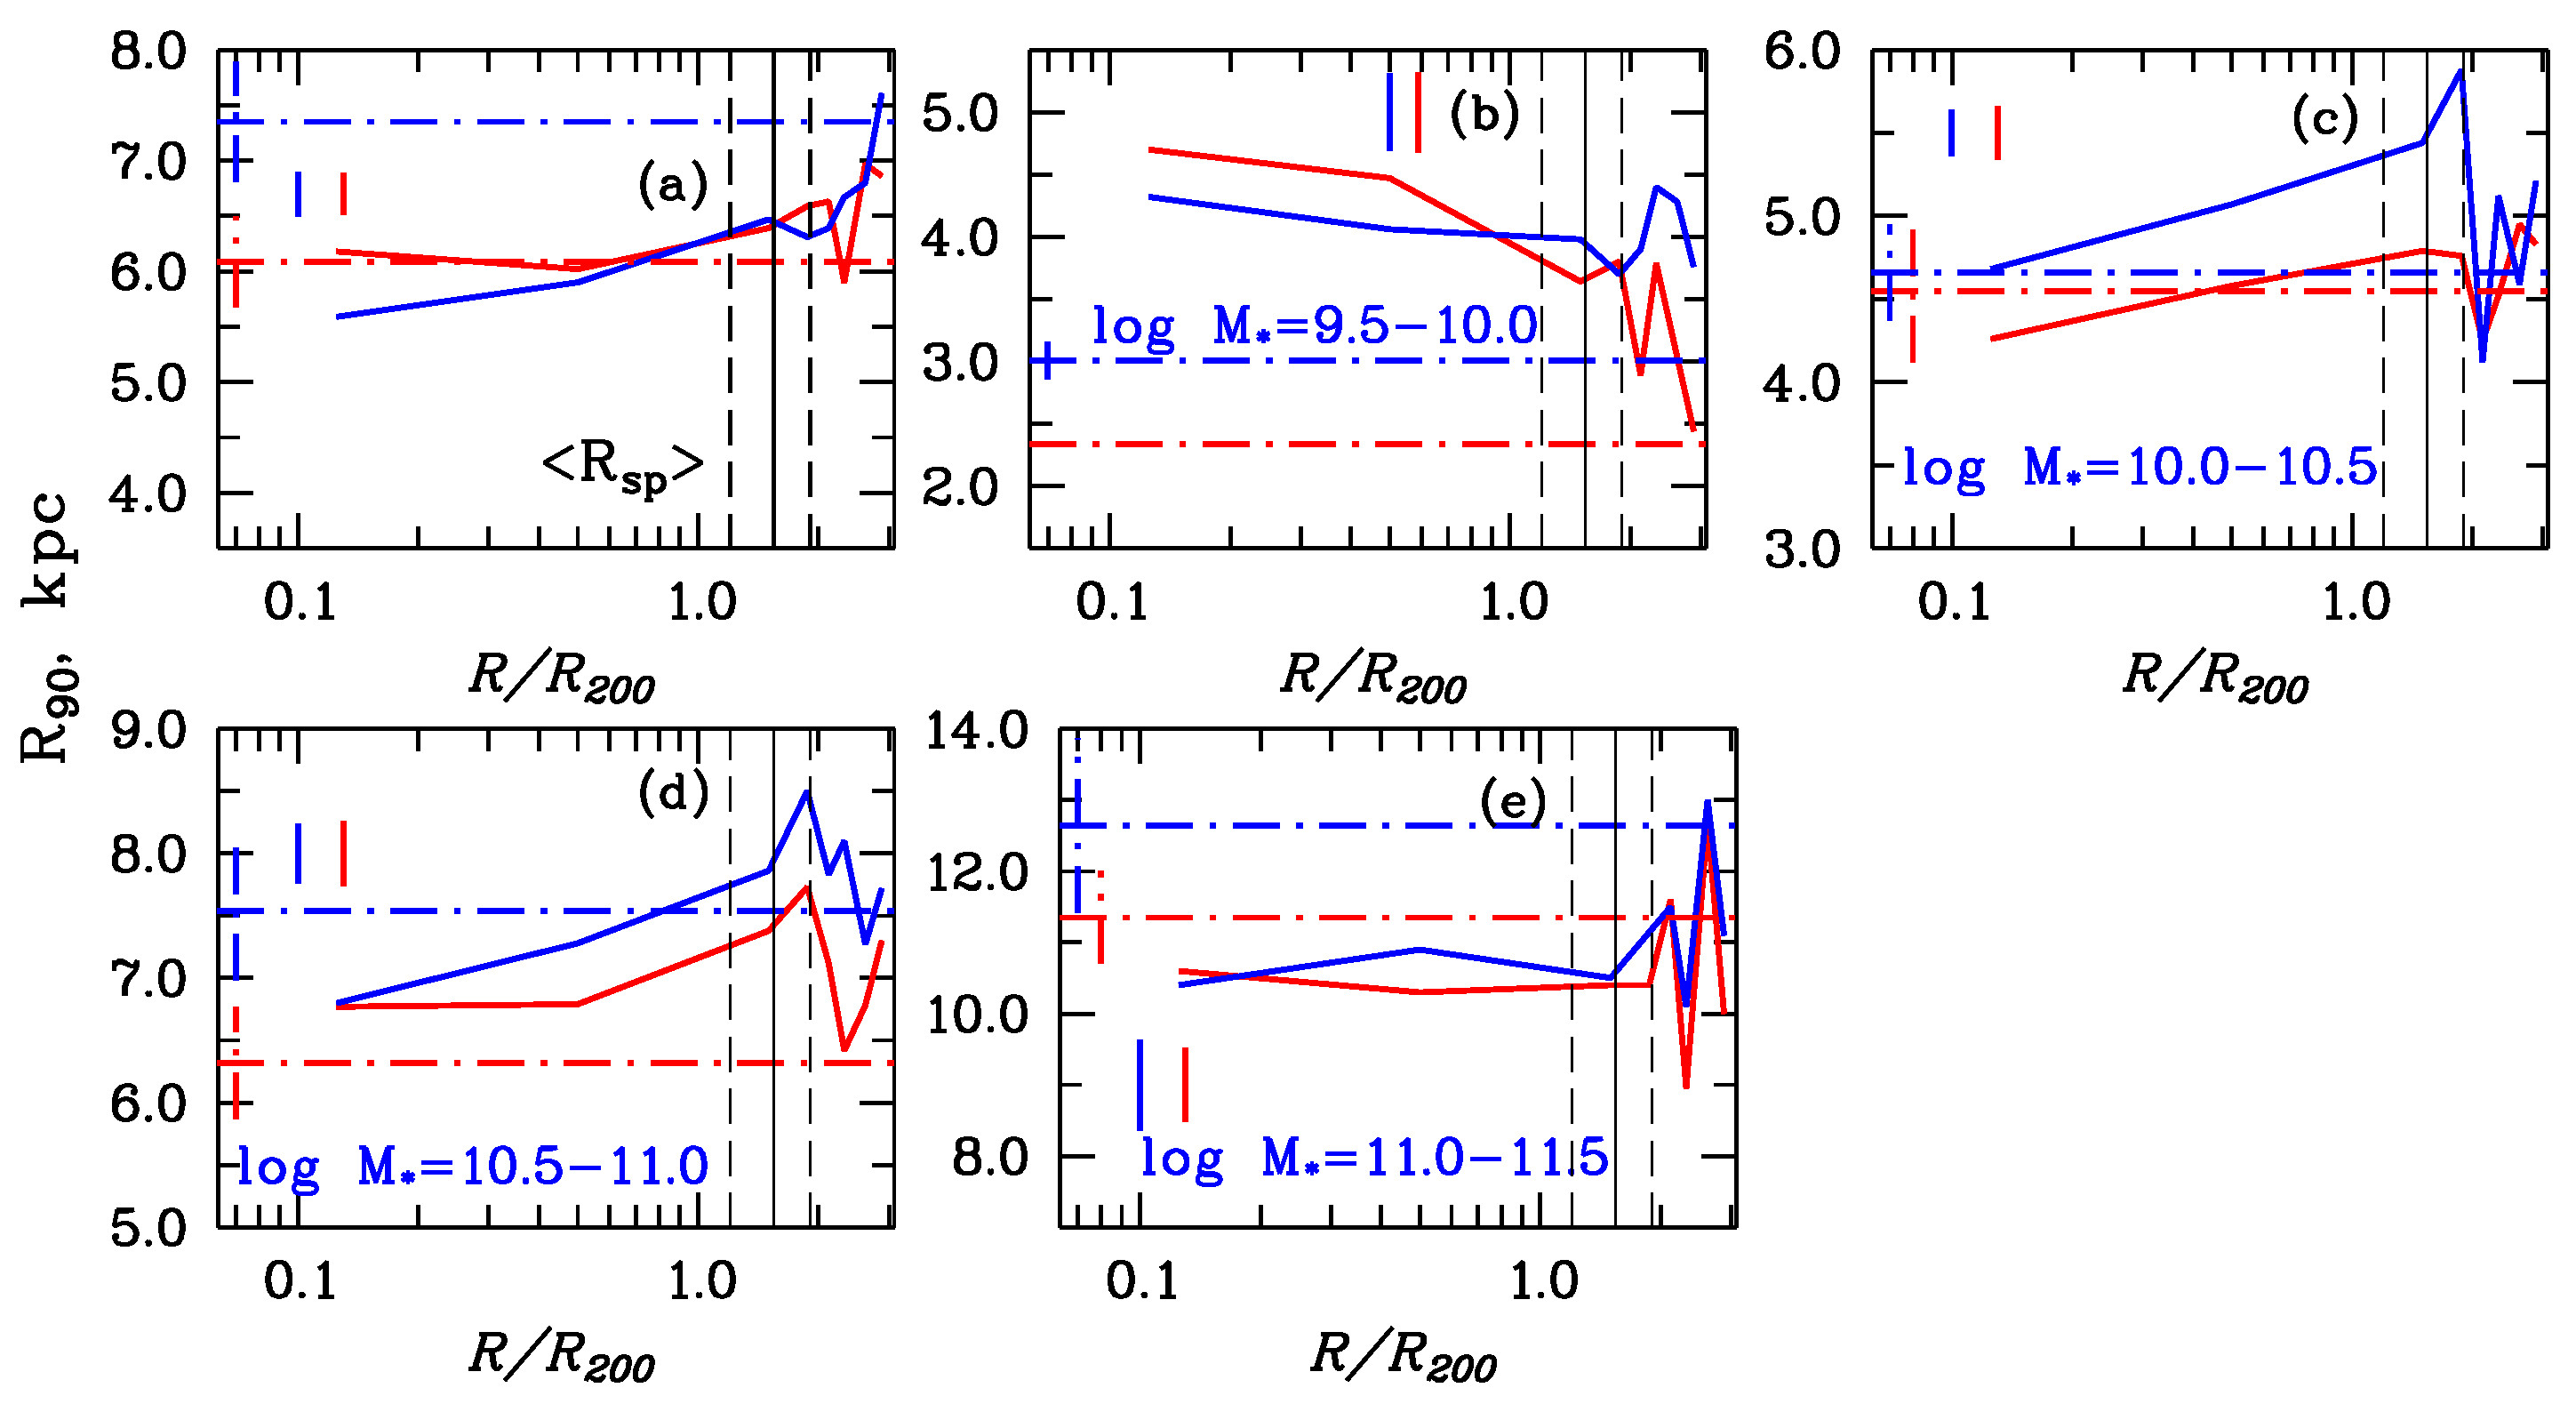
13) For 40 groups and clusters of galaxies (0.02 < z < 0.045) we studied the properties
of galaxies with quenched star-formation rate (QGs) within the "splashback"
radius Rsp of galaxy
clusters and beyond according to catalog data SDSS (Sloan Digital Sky Survey). We
show that of the QGs we found, 72% is within Rsp, among which about 40% galaxies are late-type
galaxies. About 80% QGs have stellar masses in the range log (M*/Msun) = [10,11]. We found that QGs of
late-types galaxies and to a lesser extent of the early-types ones have maximum
angular radii R90,r and R50,r near "splashback"
radius of groups and clusters of galaxies. Rsp
radii were calculated from the observed integral distribution of the number of
galaxies as a function of the squared clustercentric distance of galaxy
systems.
Kopylova F. G, Kopylov A I., Ast.Bull., 75, 4, 424, 2020. |
Fig.13. Petrosian radius of the galaxies R90 in kiloparsecs in
the r filter depending on the normalized radius R/R200c
for all galaxies with quenched star-formation rate (QGs) (figure 13a). Galaxy
clusters are stacked according to the normalized radii. QGs of the early-types
galaxies, defined by the parameter fracDeV ≥ 0.8 and the late-type ones
are shown with red and blue solid lines, respectively. Short red and blue lines
correspond to the average errors of the radius measurements. Solid and dashed
vertical lines show the mean Rsp and the range of its
changes. Dashed horizontal lines correspond to the average values R90
for the field, the vertical ones – to the error bars.
|
||